
One way to help other Global Lab students appreciate your site, what affects it and what lives on it, and compare it with their own, is to have everyone refer to plots of land that are the same size. In fact, comparing data collected from very different-sized plots can result in serious misunderstandings.
Now you have selected a study site. But what does it look like?
1. Draw a very rough outline of your whole study site.
2. Locate on the map the cardinal directions East, North, West, and South.
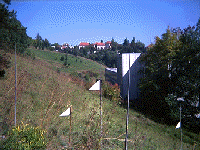
3. One way to get a rough idea of dimensions is to walk your site and locate the five most significant features of the study site and add them to the outlined map. Write in your journals why you selected these features.
4. Carefully pace off all key distances and add the measurements to the outline map. Pacing is a field technique to measure distances that was first established in Roman times. A pace is generally defined as the length of one step as measured from the heel of one foot to the heel of the other as a person strides naturally.
Since people have different strides, the pace for each pacer must be carefully measured. Starting from a stick in the ground, have one team member (the pacer) walk normally in a straight line for 50 paces. Measure the distance traveled from the stick and divide by 50. The resulting number will be the length of an average pace of your pacer. Make sure the pacer walked in a consistent, unhurried fashion for every measurement. Be sure each number is measured from features already shown on the map.
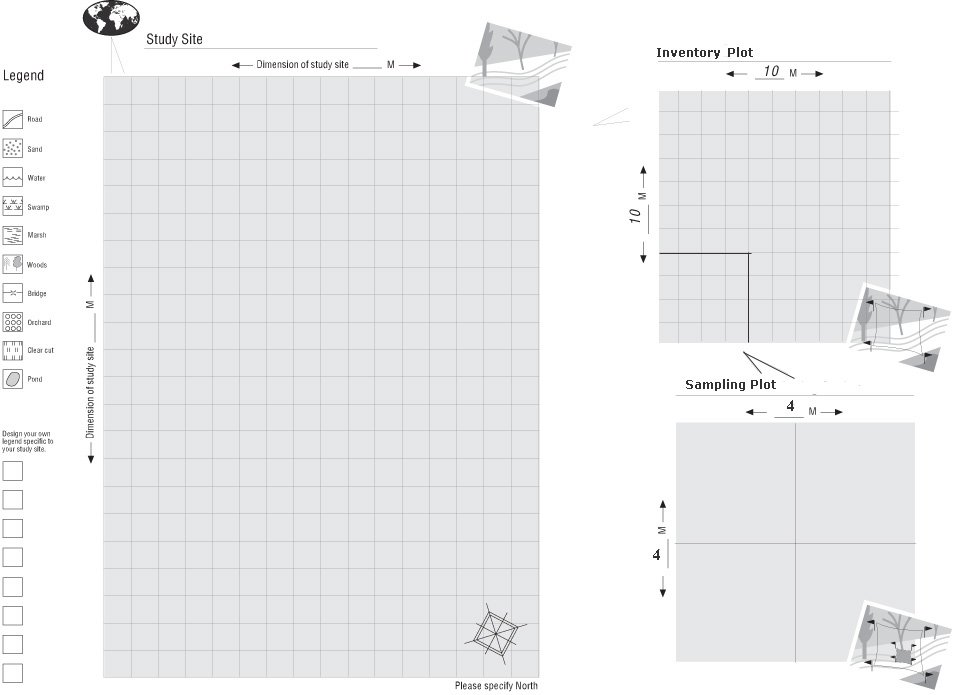
4. Use something like the study site map pictured below (a larger version is linked below.) to help with your sketch. Here is a larger (pdf) version of this map.
5. Make pictograms of your own for your study site. You can use this draft worksheet.