The ART and SCIENCE of Good Sampling
Overview:
In this activity students will explore the need for sampling in order to understand how diverse life is on their study site. They undertake two sampling exercises, one of heads and tails in a coin toss and the other of eye color. They then prepare for their trip back to their study site, in which they will perform sampling exercises with transects and quadrats.
Goals and Objectives:
The
goal of the activity is to enhance student understanding of the complexity of
gathering information and the need for sampling, under certain circumstances.
Students
will be able to:
-
define a sample
-
discuss difficulties of making a good sample
-
explain how a transect and quadrat used in the field are sampling
Time: One- two class period(s)
Background:
Field scientists collect information, but sometimes
there is just too much information to collect completely. So they collect samples that
they hope will represent much of the nature of the larger group they want to
find out about.
For example, field scientists might want to find out
the percentage of trees affected by a fungus, sociologists might wonder who are
more likely to adopt children, and laboratory scientists might want to
investigate the viruses that cause mice to develop cancer. But counting ALL trees, surveying all
people or testing all mice would be too hard.
 Sometime
scientists don't have the time or money to collect lots of data. Sometimes
they settle for a few samples.
But they hope the samples will be representative of the whole group in
which they are interested.
Sometime
scientists don't have the time or money to collect lots of data. Sometimes
they settle for a few samples.
But they hope the samples will be representative of the whole group in
which they are interested.
How
are samples collected?
Sociologists
interested in who adopts children might interview people who have been chosen
randomly from a larger group (say, every 14th page from a phone
book.)
Field
scientists interested in the tree fungus might collect some samples by laying
out random transects – lines across a natural area with counting places
spaced evenly throughout the sample.
Lab
scientists interested in viruses that cause cancer might design experiments
using randomly selected samples of mice.
How
can samples be unrepresentative?
Samples
can be quite biased, quite unrepresentative of the whole population being
questioned. A lab scientist, for
example, could select only those mice that look sick, or healthy. This is why scientists take more than
one sample, at random (without order).
If
the question is: How serious is
the tree blight in Karelia, and if one knew that a particular region of Karelia
had many diseased trees, you might not want to sample ONLY in that region.
What
about the sociologists who wanted to find out about a connection between
growing up in a large family and likelihood of adopting children in later
life? How could their sample be
biased?
Random
numbers help
Often
scientists use random (completely unordered) numbers to help them decide which
tree, which transect, which mouse or group of mice, or which set of people to
sample. That way they aren't
biased, deciding to sample and get results that are unrepresentative but
results they would LIKE.
See
a random number generator on the web: http://www.random.org/integers/
The
power of multiple samples.
The
more times you take a handful of candy from a jar and get no chocolates, the
less likely there is much chocolate in the whole candy jar. The more samples
are added together, the closer the numbers are to the true values of a
population. Scientists can use
different teams and average the samples to make the data from the sample more
representative of the problem you are studying.
STEPS
A. SAMPLING
EXERCISE 1: COIN TOSS
Ask
students to do the Coin Toss Exercise.
B. SAMPLING EXERCISE 2: EYE COLOR
Question:
What fraction of the class has brown eyes?
In
exercise one, you knew that half the coins should come up heads. This time, you
don't know what to expect. If you looked at only some of the students, how
close would you come to the actual fraction of brown-eyed students in your
class? In the entire country?
1.
Divide the class into two equal groups at random. What is a good way to be sure
there is no bias? Call one group A, the other B.
2.
Count the number of brown-eyed students in group A.
3.
Use the data for group A to PREDICT the number of brown-eyed students in group
B. Every student should write down a prediction.
4.
Count the number of brown-eyed students in group B. How good were the
predictions? What was the best prediction?
5.
Suppose this was repeated for every class in the country. You go to every class
and bet on its B group. How would you bet? How often do you think you would be
right?
6.
Discus whether your data would predict the fraction of people in the whole
country with brown eyes.
C. SAMPLING WORK 3: QUADRATS AND TRANSECTS
Explain
to your students that in the next field trip they will be taking samples of the
plants in the study site, and that they will try to decide how diverse plant
life is on the site.
Ask
them how they might sample the vegetation. Hopefully your students will develop
ideas somewhat like the approaches embodied in quadrats and transects.
Have
student teams construct any needed quadrats and tie knots every meter in 10
meter ropes for the transects.
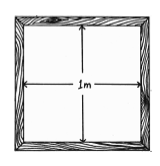 The quadrat frame is a simple square usually
constructed from wood. Alternatively, you can cut out a cardboard template and
have students create a string or rope quadrat frame at the study site. If your study site has small
plants and dense vegetation, use a 10 by 10 centimeters quadrat, but if your site has larger plants (predominantly shrubs or trees) use a 1
by 1 meter quadrat.
The quadrat frame is a simple square usually
constructed from wood. Alternatively, you can cut out a cardboard template and
have students create a string or rope quadrat frame at the study site. If your study site has small
plants and dense vegetation, use a 10 by 10 centimeters quadrat, but if your site has larger plants (predominantly shrubs or trees) use a 1
by 1 meter quadrat.