Working
with Data
A graph is a diagram that presents quantitative information (numbers) for easy comparison or interpretation. There are many different types of graphs. Three basic types are bar graphs, circle graphs, and scatter graphs.
Bar Graphs
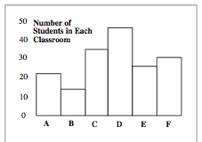
A bar graph is a set of rectangles of equal width whose
heights represent a measure - how many or how much there is of any
one type of data.
In the first sample bar graph, there are 45 students in classroom D, the
classroom with the most students, and only 14 students in classroom B, the
classroom with the fewest students. How many in Classroom F?
Write your answer below:
Classrooms
Advanced?: In the
above example, the students can easily be grouped, for example, by classroom, but what if the data
cannot be grouped easily?
Go to <http://enlvm.usu.edu/ma/nav/bb_dlib.jsp>
to play with bar graphs.
Pie Charts (or Circle
Graphs)
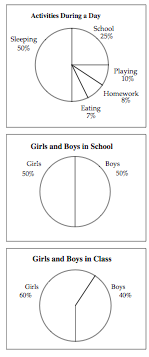
A
circle graph is a circle divided into pie pieces that represent parts of the
total. Look at the first circle graph; an entire day for one person is shown.
Half (50%) of this person's day is spent sleeping; A quarter (25%) is spent in
school; 10% is spent playing; 8% is spent doing homework; and 7% is spent eating.
In
a circle graph, the different sections are only meaningful in terms of the
total. The sections represent percentages, not the actual number of that
type of data. Because of this characteristic, circle graphs assist in
comparisons between two or more groups with different totals.
The
next two graphs show another example: In an imaginary school, half of the
students are girls and half are boys. (Graph 2) In one class at this school,
however, there are more girls than boys. Six out of every 10 students is a
girl. These circle graphs can be compared even though the one circle graph
represents all the students in the school, while the other represents only the
students in one class at the school. The number of students does not matter.
Only the percentage of students matters.
By
what percentage does the proportions of girls in class differ from those in
school?
Go to <http://enlvm.usu.edu/ma/nav/bb_dlib.jsp> to play
with pie charts.
Extra Credit: If you want to take a side trip to
Histograms, go here.
Go on to Table/Scatter Graphs.
AND Table Graphs
also
called Scatter Graphs
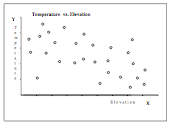
In a scatter graph, one variable (such as temperature on your study site) is plotted against another variable (such as elevation). The two variables are linked; they come as a pair.
So let’s consider temperature and elevation; in general, the higher the elevation the cooler the temperature. A scatter graph can show such a relationship. The relationship is not perfect, however, since many things other than elevation affect temperature. The points are scattered.
The points represent ordered pairs (X,Y). In this example (elevation, temperature).
Does temperature increase or decrease with elevation?
Write your answer below.
Go to <http://enlvm.usu.edu/ma/nav/bb_dlib.jsp> to play to play with scatter graphs.