Teacher guide Ideas for improvement are welcome! (barbara@concord.org) |
Activity-at-a-GlanceStudents play out simplified versions of a real-world problem of water allocation. By assuming the identity of nations in collision over water, they explore the interplay of scientific and social issues. In the process, they learn about the social context of water issues, the disputes that arise, and ways in which they may be resolved. |
Materials (for a class of 24-32 students)
80 white--for people 80 red--for pollution (Simulation #2 only) |
Classroom Management and PreparationBreak the class into groups of six students. Distribute ‘extra’ students to make groups of eight. Divide each group into an upstream (Upland) team and a downstream (Deltaland) team. Each team should appoint a Mathematician who figures out how many chips to move, an Historian, who records the history of the country that the game is simulating, and a Facilitator who watches the rules and helps the team decide what to do. The fourth player, if present, is the Negotiator who meets with the other country, particularly in simulation #2. |
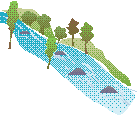
Recommended Procedures1. Set the stage. The Quint river flows down a virtual continent. There are two countries, Upland and Deltaland. Upland is sparsely populated and poor. It has beautiful mountains that trap the rain and snow, producing lots of water. Deltaland is richer because it has always been a trading country. It doesn’t rain much there, but it has always relied on the Quint river for water, and images of it are deep in its mythology. 2. Distribute simulation equipment. For Simulation #1, each team needs the following:
3. Explain the rules for Simulation #1: The counters. The counters stand for different variables: Each water counter stands for a fixed amount of drinkable rain and river water. Each population counter stands for one million people. Obviously, the people (population counters) need good water (water counters). Each population chip in richer countries uses more water chips than poorer countries. 4. Play Simulation #1. Start the simulation in 1900 with two population counters in Upland and four in Deltaland. Have each team make ten moves, representing the ten decades in the twentieth century. Each Move represents a decade and starts with a rain, which adds water counters to both countries. Upland plays first, using some water and sending the balance to Deltaland. Its population then grows depending on how well-off the population is. Deltaland plays next, using some water and then growing. The Rule Cards determine how much water the populations consume and how they grow. The Rain Cycles. The amount of rain each decade is determined by the roll of two dice. The number of water counters Deltaland gets is the sum of the dice thrown, but never more than eight. This means that a roll of: –two to eight results in that number of rain counters for Deltaland. Nine, ten, eleven, or twelve all result in eight rain counters Deltaland. This results in droughts happening at random. Half the years having good rain (7 or 8 counters), but occasionally there is moderate drought (4 to 6 counters) or severe drought (2 or 3 counters). Upland always gets three times the rain Deltaland gets. This is because both countries have the same general weather patterns, but Upland mountains capture more of the rain. Thus, Upland gets between 6 and 24 counters in a decade. To summarize, each decade consists of the following five steps: 5. Water is passed along. All the remaining water counters are sent on to the ocean. Encourage students to discuss the simulation critically as they play. What is the reasoning behind the rules? How do the simulation rules relate to real situations? Where does that “used” water go? What would life be like in the two countries during each decade? Review the notes the historian made and have the team agree on their country’s history of the decade. |
NOW STUDENTS ARE READY TO PLAY SIMULATION 2 |
 UPSTREAM-DOWNSTREAM: Sharing Water Simulation