Global Lab Air Images (teacher/student background sheet)
Air Image 1
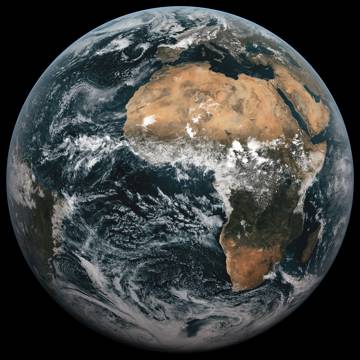
This image shows Earth as a flattened, composite image. It emphasizes cloud patterns and global circulation.
This illustration, as a part of NASA’s program of Earth science research, shows the world’s cloud cover pattern assembled from weather satellite images made at infrared wavelengths. This kind of information enables scientists to study global cloudiness and to improve our understanding of how clouds affect climate.
Source: http://ti.arc.nasa.gov/projects/worldwind/images/screenshots/13.jpg
The colors on the image correspond to four separate scales: clouds, water, ice or snow, and land. Within any one scale (for example, land), the different colors (red to yellow) are determined by the wavelength of the light reflected. For the Air unit, the clouds are supposed to be the focus, but if students are interested, careful examination of the land, water, and ice/snow will suggest latitudinal temperature differences.
This image is a good one to consider for atmospheric circulation. Notice how the clouds are divided roughly into three horizontal bands. Around the equator, the cloud cover is quite different from the cloud cover at higher latitudes.
The band around the equator is known as the intertropical convergence zone (ITCZ). It is a band of clouds caused by the convergence and rising of the air. The relatively constant Sun angle at the equator means that the air is warmer and full of energy. As the air rises, it cools and expands causing its moisture to condense forming clouds and precipitation.
The spiral near the top left of
the image is a cyclonic system. Such systems, also known as wave
cyclones, dominate the middle and upper latitudes. They are moving areas in
which the air at the center is converging near the surface, rising, and
diverging higher in the atmosphere. Since the system is moving, the Coriolis
force causes it to spin which pulls
warm air from the equator and cold air from the poles. For more on the Coriolis
force, see the student reading Atmospheric Circulation.
Here
is another picture to examine. (Source:
Meteosat – Public
Domain) What can you discover as you look carefully at
it?
Air Image 2
NASA Photo ID: STS047-54-018
Date Taken: 09/20/92
This image shows the Earth at sunset/sunrise and emphasizes atmospheric layers, light scattering, and light refraction. The colors of this sunrise/sunset scene provide insights into the relative density of the Earth’s atmosphere (15.5S, 158.5E). This scene captures the silhouette of several thunderstorms with their cirrus anvil tops spreading out against the tropopause—the top of the lowest layer of atmosphere, the troposphere, which is also the most dense and refracts light at the red end of the spectrum while the blues refract in the stratosphere.
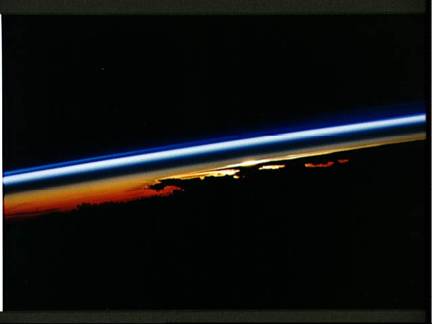
http://images.jsc.nasa.gov/luceneweb/fullimage.jsp?photoId=STS047-54-018
This image of the Earth’s limb is a good one for considering atmospheric layers and the interaction between sunlight and the atmosphere. The black at the top of the image is space, whereas the black of the bottom of the image is the surface of the Earth and storm clouds. The Earth’s surface and clouds are black because the Sun is behind them. Indeed, a tiny sliver of the Sun can be seen just to the right of center. In this image the clouds rise high enough into the atmosphere to block the Sun from direct view, but they do not rise all the way to the top of the atmosphere. Clouds, and all other weather patterns, are confined to the troposphere, the lowest layer of the atmosphere.
The atmosphere can be seen in
this image because of the way it scatters and refracts light. Four primary
factors go into creating the separation of colors that you see in the image.
• First, the density of the atmosphere decreases with elevation. In other words, there are more gas atoms and molecules near the Earth’s surface than there are higher in the atmosphere.
• Second, the size of the gas atoms and molecules causes them to scatter the shorter visible wavelengths (blue and violet) more than they scatter the longer visible wavelengths (orange and red). That is, blue light is scattered more easily than red light in our atmosphere.
• Third, light scattering increases as light passes through more atmosphere and denser atmosphere.
• And finally, as the light passes from space into the atmosphere, it is moving from one medium (space, which is a vacuum) into another medium (the atmosphere, which is a mixture of gases). During this transition light bends and separates into different colors, just like a prism. (It is interesting to note that this refraction extends our daylight by approximately 8 minutes, as the Sun is actually about 4 minutes below the horizon when it appears to be rising or setting.)
Consider the image again. The light passing near the Earth’s surface
appears orange and red because that light is passing through the dense part of the atmosphere. In the dense part of the atmosphere, there are more gas atoms and molecules. These atoms and molecules scatter the light, but they scatter the blue and violet light more than they scatter the red and orange light. Since some orange and red light is not scattered, it passes through the atmosphere to reach the camera. The light passing higher up in the atmosphere encounters fewer atoms and molecules. The blue and violet light is still scattered somewhat, but most of it passes through to reach the camera. In addition, the atmosphere is refracting the light like a prism, so more blue light is refracted toward the camera by the upper atmosphere and more red light is refracted toward the camera by the lower atmosphere.
Note that particles suspended in
the atmosphere also scatter light. For example, smoggy or hazy skies appear
white because the larger size of the pollution particles scatters a lot of
light at all visible wavelengths.
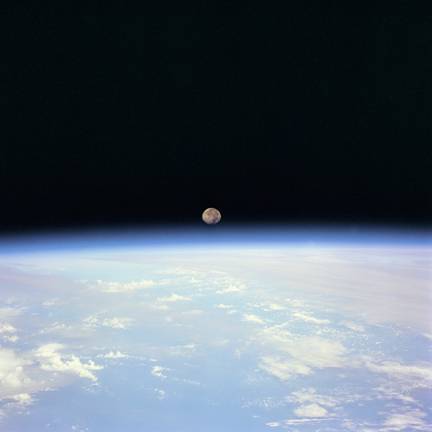
Here is another picture of the atmosphere, with the moon in sight:
http://grin.hq.nasa.gov/IMAGES/SMALL/GPN-2000-001046.jpg