bugs

Calculating the Biodiversity Index

Diversity is defined as the measure of the number of different species in a biotic community. Generally speaking, diversity is high when there are many different species in a community and and low when there are few.

Comparing the diversity of two or more different biotic communities can give an idea of the comparative stability and health of those communities. Comparing and analyzing the results can be difficult if all you have to work with are lists of life forms from different sites.

When scientists are faced with this problem, they often create an index. An index is a scale by which your object of study can be rated, and then compared to other things of the same type. A biodiversity index is a scale of the diversity of plant and animal species at your study site. Biodiversty is a widely used tool for estimating the complexity, stability, and thus general health of an ecosystem.

One example of an index is a report card. Performance on a test or assignment places a student’s work in a range (for example, 80 to 83 percent). That range is then translated into a ranking on a scale (B–). Put simply, an index turns complicated and difficult-to-compare data—like school assignments or lists of life forms—into numerical data which are easier to analyze.

The ideal way to measure diversity is to count every species in sight. However, this approach requires much time and considerable expertise in taxonomic classification. This worksheet describes how you can turn the data collected at the sampling plot into an index of biodiversity. You will calculate the biodiversity index using the data gathered at the study site. You can submit your biodiversity index value to the Biodiversity Project.
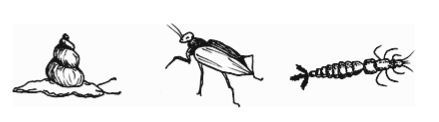
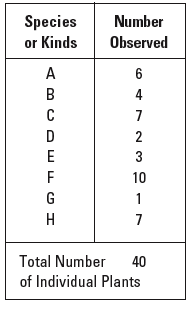
Gathering Raw Data


During the trip to the study site, an abundance reporter was asked to record the number of individuals of each plant species growing within a particular space. Gather this data together in a chart like the one below. Each line in the chart represents one of thespecies observed and the number of individuals of that species.

biodiversity table

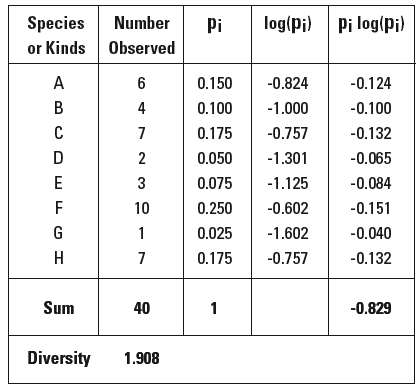
The Biodiversity Formula


The diversity formula is a mathematical formula that allows you to estimate
the diversity in an entire sample—in this case, the quadrat. We make the
assumption that the diversity found within the quadrat is representative of
your study site as a whole.

Biodiversity Index = –2.303 x sum of pi log(pi)

Materials


calculator that includes a
log function
grid paper

Procedure


1 In the formula, pi is the number of a particular kind of plant divided by the total number of plants observed. For instance, if you look at species B in the chart above, you will see that 4 were observed, and since there were a total of 40 different individual plants in the sample, then 4/40 represents B’s fraction of the total observed. You will see in the third column, under
pi, the result of 4/40 which is .1.
2 Complete the formula by multiplying the values in the third and fourth columns. In the case of species B, .1 x -1 = -0.100.
3 Using the calculator, find the log of pi. For example, the log of .1 is –1, which is recorded in the fourth column.
4 Finally, to get a diversity value for the whole set of data, sum all the values in the fifth column and multiply this times the “magic number” –2.303. For our sample set, the sum of values in the fifth column is –0.829, multiplied by the magic number –2.303 equals 1.908. This is the biodiversity index value for this sample set. The higher the biodiversity index value, the more diverse the sample.
5 Enter the biodiversity index value for your sampling plot onto the Inventory Database worksheet. Eventually you will submit all these data to the Global Lab Inventory Database on the Web.

biodiversity table 2

Back to Global Lab Water Life Index

Back to Global Lab Water Index